data(iris)
boxplot(iris$Petal.Length ~ iris$Species)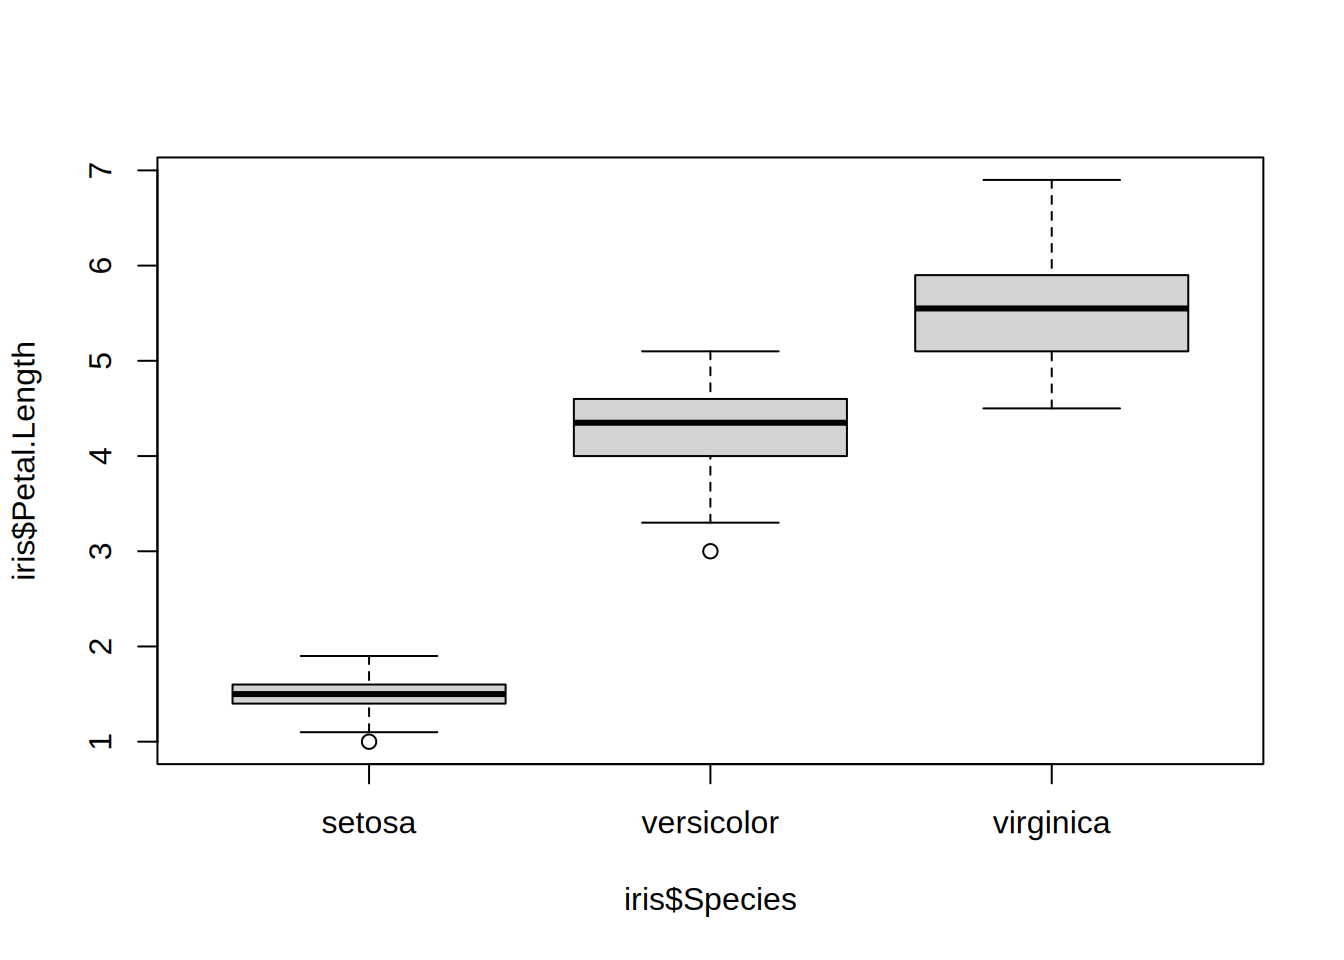
Some functions in R use a so called formula as their argument. Look e.g. at the help page of boxplot() to see that it’s able to takes an argument formula which is describes as follows:
a formula, such as y ~ grp, where y is a numeric vector of data values to be split into groups according to the grouping variable grp (usually a factor).
So the example code below using the iris dataset reads like: make me a boxplot of the petal length split into groups by the species.
data(iris)
boxplot(iris$Petal.Length ~ iris$Species)
A lot of statistical functions use this notation. As a beginner you most likely find formulas in boxplot(), plot() and lm(). More general, think about the ~ like as a function of. So boxplot(iris$Petal.Length ~ iris$Species) means: Give me boxplots of the petal length as a function of the species. Some more examples:
# Show me the Sepal.Length as a function of Petal.Length
plot(iris$Sepal.Length ~ iris$Petal.Length)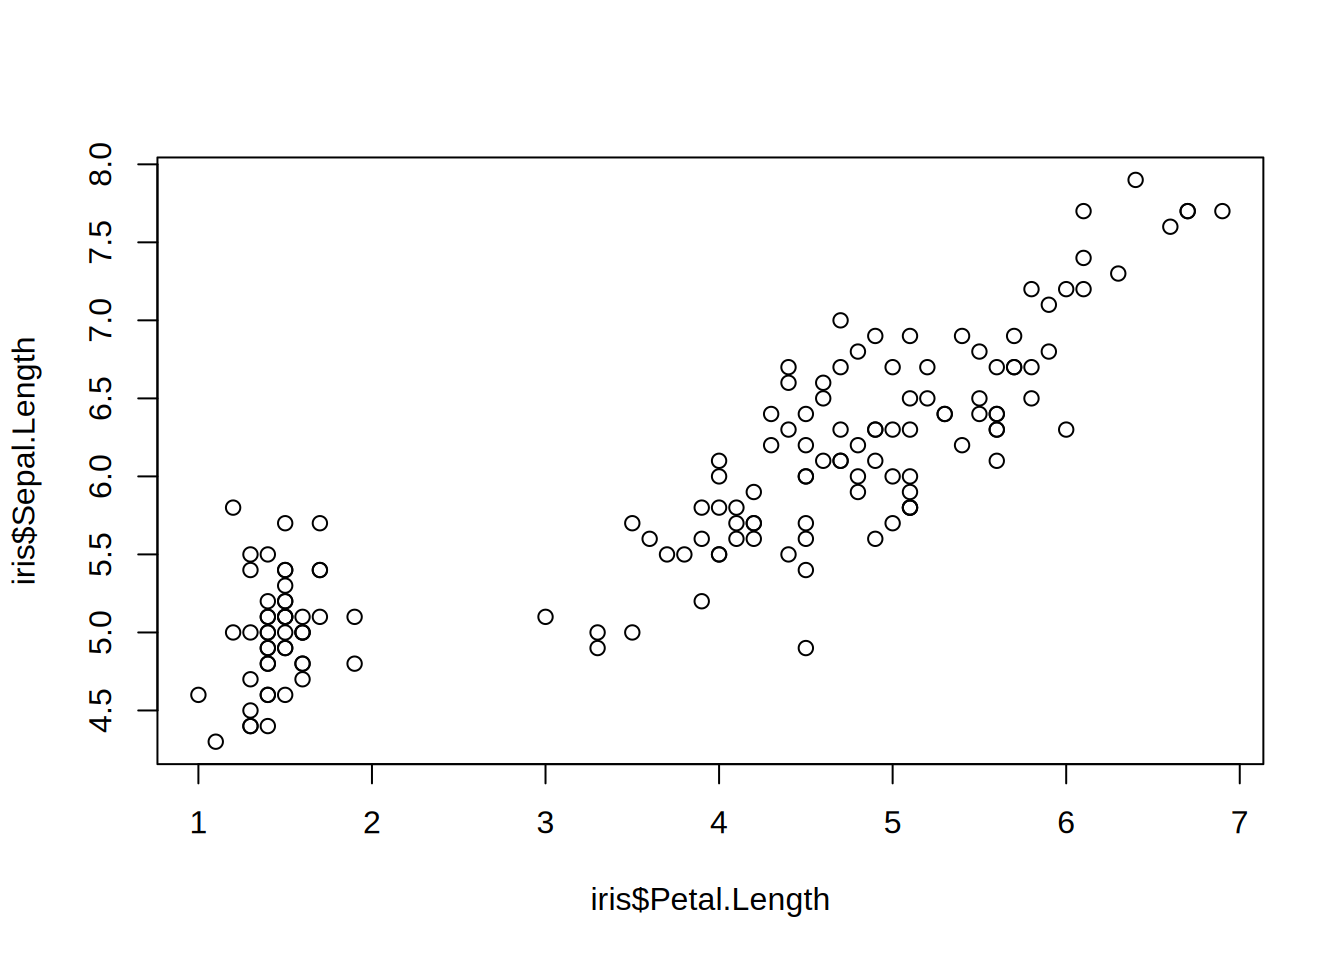
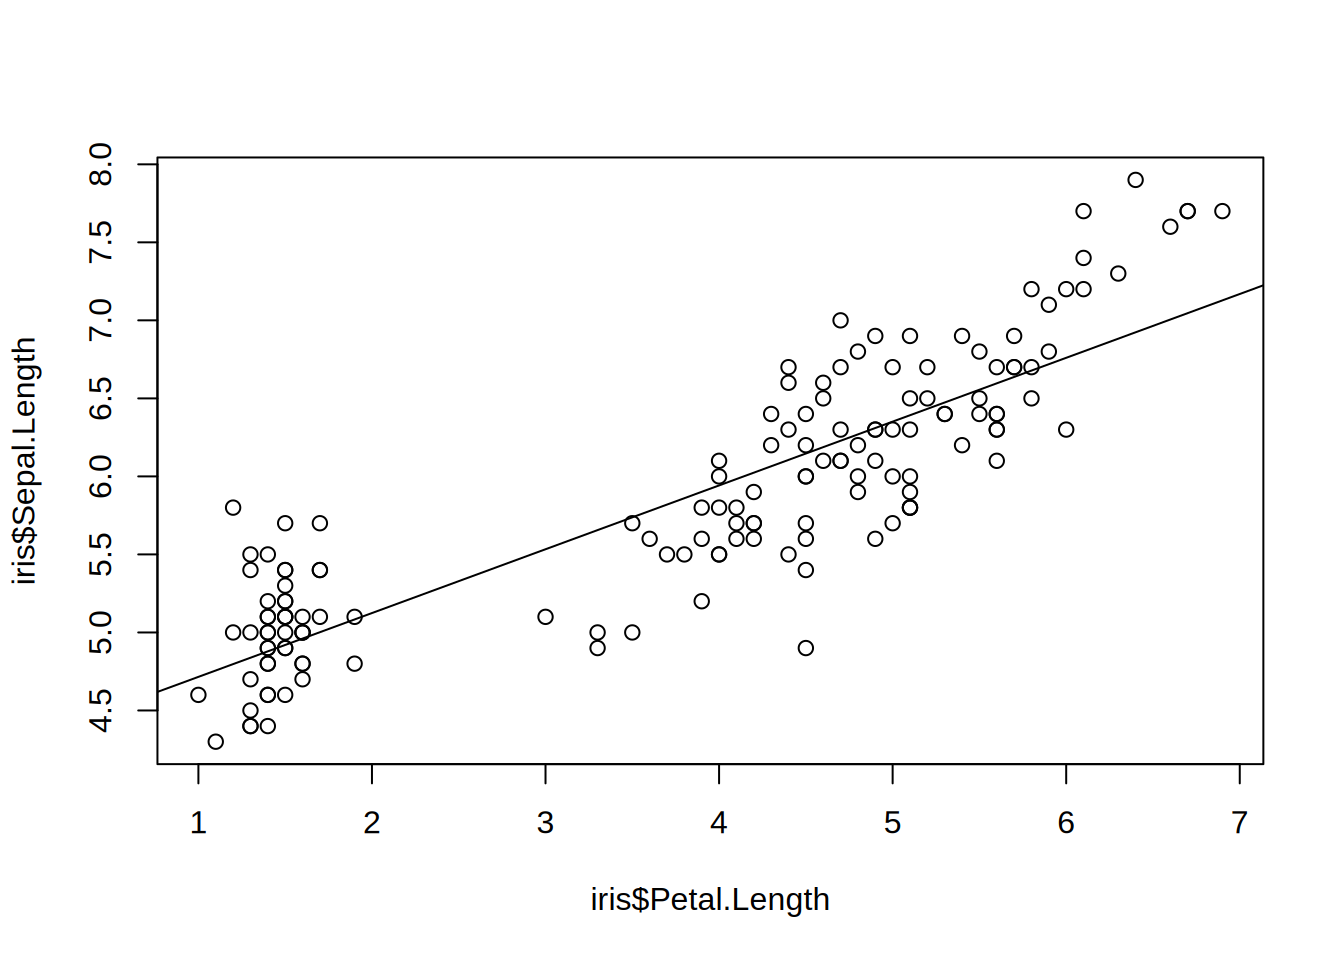
# calculate the relation between Sepal.Length and Petal.Length
# model Sepal.Length as a function of Petal.Length


lmod = lm(iris$Sepal.Length ~ iris$Petal.Length)

plot(iris$Sepal.Length ~ iris$Petal.Length)
abline(lmod)